This application manage costs analysis using Tableau, with monthly costs data. Data are analysed using graph features from Tableau. Data presented are not real and its organisation is a possibility that depends on each one preferences.
Data Fields
Data analysed in this application are recorded in a table with below specified columns. All data values used are listed in Tableau tab Raw Data.
| Column | Content |
|---|---|
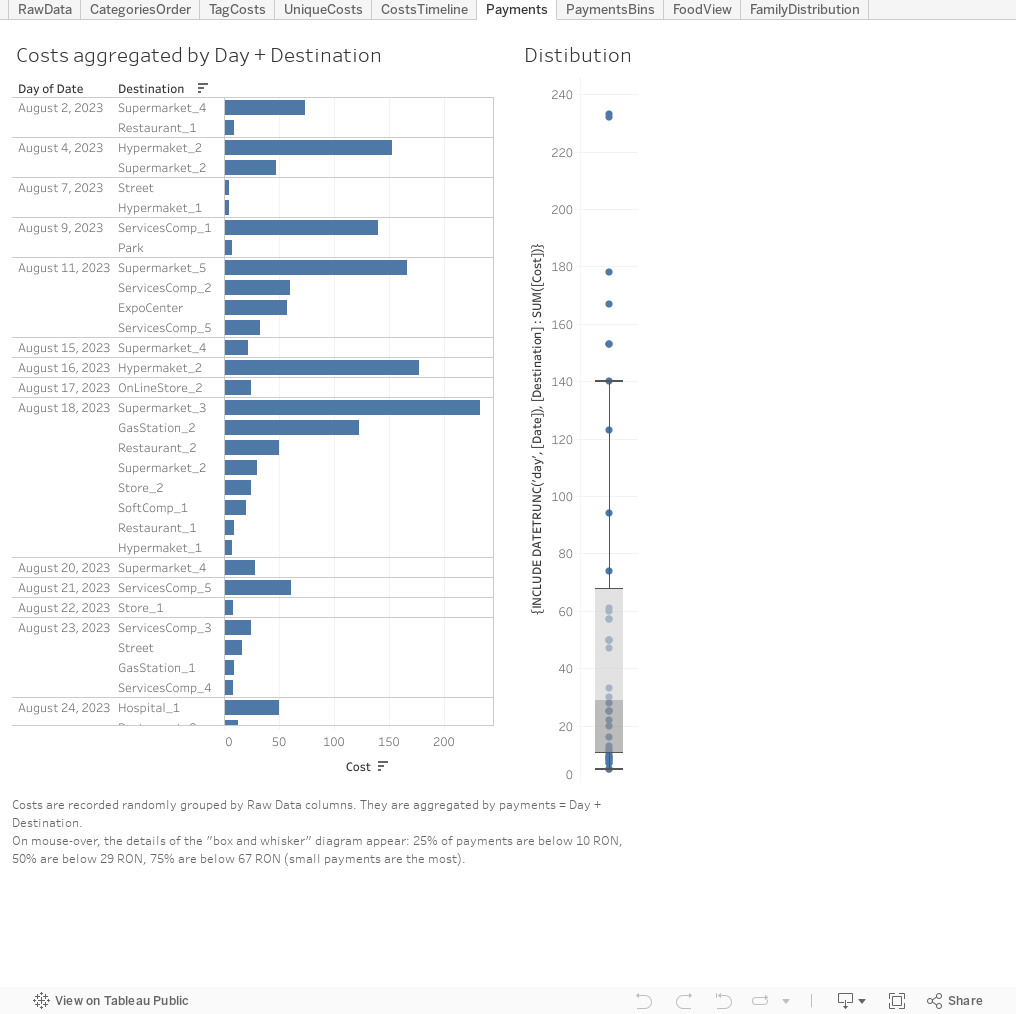
| Date | The date when the Cost was made |
| Destination | The Destination where the Cost was spent |
| Cost | The Cost amount |
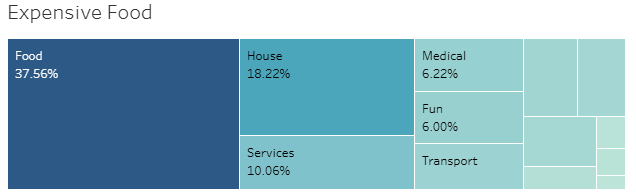
| Category | The Category of the products bought with Cost. Possible values: Food, House, Services, Medical, Fun, Transport, Clothes, Communication, Restaurant, Didactic, Car, Donation, Religion |
| Tags | Some random and optional characteristics, comments, usage of the products. Sample values: Sport, Kids, Expo, FestiveDay, ForCook, Supplements. |
| Unique | Values: u, uy, <empty>. The rows with empty cells holds the Costs that are regular/not unique in current month. The uy rows holds the Costs that are unique in the month, but regular during the year, while the u rows holds Costs that are unique |
| Source | Member of the family that bought the product with the specified Cost |